Definition: Fiber attenuation is the measurable reduction in optical signal power as light travels through glass fiber, expressed in decibels per kilometer (dB/km) — the foundational metric that determines whether an optical link will meet its power budget and deliver error-free transmission across any distance. [Source: IEC 60793-1-40]
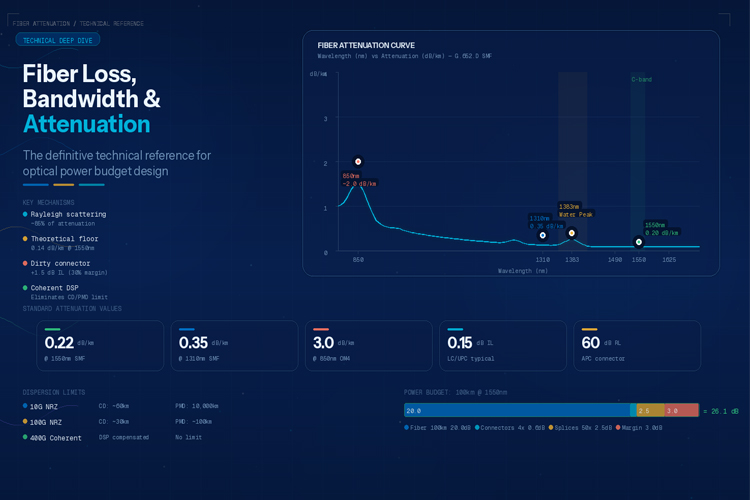
Understanding Light Loss in Fiber Optic Systems
Every meter of fiber, every connector, every splice, and every wavelength of light introduces some degree of loss. In fiber optic communications, understanding — and minimizing — these losses is the difference between a working system and a failed optical budget. This guide provides the definitive technical reference for fiber loss, bandwidth, and attenuation parameters.
"The optical power budget is the foundational calculation for every fiber optic system design. Get it wrong and the link fails — sometimes immediately, sometimes after months of marginal performance that degrades under temperature cycling or fiber aging. There are no shortcuts." — Dr. Govind P. Agrawal, University of Rochester, "Fiber-Optic Communication Systems" (4th Edition, 2013)
Attenuation: The Inevitable Light Loss
Attenuation is the reduction in optical signal power as it travels through fiber. It is expressed in dB (decibels) and measured per kilometer (dB/km).
The Attenuation Equation:
Total Loss (dB) = Attenuation (dB/km) × Distance (km) + Connector Loss (dB) + Splice Loss (dB)
Fundamental Attenuation Mechanisms
1. Rayleigh Scattering (Major Contributor: ~85% of attenuation)
Rayleigh scattering occurs when light scatters off microscopic fluctuations in the glass's refractive index — remnants of the fiber manufacturing process. This is the dominant attenuation mechanism in modern fibers. Per IEC 60793-1-40, Rayleigh scattering loss follows: α_Rayleigh (dB/km) = (C / λ⁴), where C is a material constant and λ is wavelength in μm.
Key Insight: Rayleigh scattering is inversely proportional to λ⁴ — shorter wavelengths scatter far more. This is why 850nm (MMF) has 5× more scattering loss than 1550nm (SMF).
2. Infrared Absorption (Major Contributor: ~10% of attenuation)
At wavelengths above 1600nm, the glass itself absorbs light energy, converting it to heat. Infrared absorption becomes significant at wavelengths beyond the C-band (1530-1565nm) — relevant for future L-band (1565-1625nm) DWDM systems.
3. Ultraviolet Absorption (Minor Contributor: ~5%)
Electronic transitions in the glass material absorb light below 800nm — why multimode fiber at 850nm has higher loss than at 1300nm.
4. Hydroxyl (OH⁻) Absorption Peaks
The water molecule's hydroxyl ion creates absorption peaks at 1240nm and 1383nm. This is why "low-water-peak" (LWP) fiber (G.652.C and G.652.D) was developed — to suppress the 1383nm peak for full-spectrum operation including the 1400nm band.
Standard Attenuation Values
Single-Mode Fiber (per IEC 60793-1-40 and ITU-T G.652):
| Wavelength |
G.652.A/B |
G.652.C/D (LWP) |
G.655.C |
| 1310nm |
≤ 0.35 dB/km |
≤ 0.35 dB/km |
≤ 0.35 dB/km |
| 1383nm |
≤ 0.40 dB/km |
≤ 0.31 dB/km |
≤ 0.35 dB/km |
| 1550nm |
≤ 0.22 dB/km |
≤ 0.22 dB/km |
≤ 0.22 dB/km |
| 1625nm |
≤ 0.25 dB/km |
≤ 0.25 dB/km |
≤ 0.25 dB/km |
Real-world values (premium fiber, 2026):
G.652.D @ 1310nm: 0.32-0.35 dB/km (typical)
G.652.D @ 1550nm: 0.18-0.20 dB/km (typical)
Corning SMF-28e+ @ 1550nm: 0.17-0.19 dB/km
Multimode Fiber (per IEC 60793-1-40):
| Wavelength |
OM1/OM2 |
OM3/OM4 |
OM5 |
| 850nm |
≤ 3.5 dB/km |
≤ 3.0 dB/km |
≤ 3.0 dB/km |
| 1300nm |
≤ 1.5 dB/km |
≤ 1.5 dB/km |
≤ 1.5 dB/km |
Connector & Splice Loss
Per IEC 61300-3-4, insertion loss is the ratio of input power to output power: IL (dB) = -10 × log₁₀ (P_out / P_in)
Standard Connector IL Values:
| Connector Type |
IL Maximum |
IL Typical |
Standard |
| LC/UPC |
0.30 dB |
0.08-0.15 dB |
IEC 61754-20 |
| SC/UPC |
0.30 dB |
0.08-0.15 dB |
IEC 61754-4 |
| FC/UPC |
0.30 dB |
0.08-0.15 dB |
IEC 61754-13 |
| LC/APC |
0.30 dB |
0.10-0.18 dB |
IEC 61754-20 |
| SC/APC |
0.30 dB |
0.10-0.18 dB |
IEC 61754-4 |
| MPO-12 (8F) |
0.50 dB |
0.15-0.25 dB |
IEC 61754-7 |
| E2000 |
0.25 dB |
0.05-0.10 dB |
IEC 61754-15 |
Return Loss (RL):
| Polish Type |
Return Loss (Min) |
Typical |
| PC |
≥ 40 dB |
42-45 dB |
| UPC |
≥ 50 dB |
52-55 dB |
| APC |
≥ 60 dB |
62-65 dB |
"Per IEEE 802.3, high-speed Ethernet transceivers (10G SFP+) can experience 1-3 dB of performance degradation when return loss falls below 20 dB. For GPON OLTs, return loss of ≥ 50 dB (UPC) or ≥ 60 dB (APC) is mandatory to prevent reflected light from desensitizing the receiver." — IEEE 802.3-2022 Clause 58
Fusion Splice Loss:
| Splice Type |
Typical Loss |
Measurement Standard |
| Fusion splice (SM) |
0.03-0.08 dB |
IEC 60793-1-40 |
| Fusion splice (MM) |
0.02-0.05 dB |
IEC 60793-1-40 |
| Mechanical splice |
0.1-0.3 dB |
Not recommended |
Chromatic Dispersion (CD)
Chromatic dispersion occurs because different wavelengths of light travel at different speeds in glass. A pulse containing multiple wavelengths spreads out as it travels — limiting bandwidth.
D(λ) = (S₀/4) × (λ - λ₀⁴/λ³)
| Wavelength |
Dispersion |
Total (100km) |
Key Limitation |
| 1310nm |
0 ps/(nm·km) |
~17 ps/nm |
DWDM not possible |
| 1550nm (C-band) |
17-18 ps/(nm·km) |
1700 ps/nm |
Limits bitrate × distance |
| 1625nm (L-band) |
21 ps/(nm·km) |
2100 ps/nm |
Limits high-speed long-haul |
"For 100G+ coherent systems using DP-QPSK or DP-16QAM modulation, chromatic dispersion is fully compensated in the DSP — the primary limitation becomes OSNR rather than CD. This is why coherent technology has revolutionized long-haul fiber transmission." — Agrawal, "Nonlinear Fiber Optics" (6th Edition, 2019)
Polarization Mode Dispersion (PMD)
PMD occurs because real fibers have slight birefringence — the two polarization modes travel at slightly different speeds, causing pulse spreading over long distances. Per IEC 60793-1-48: PMD_Q = Σ PMD_i² / √L (ps/√km)
| Standard |
PMD Maximum |
Typical |
| G.652.D |
≤ 0.20 ps/√km |
0.04-0.08 ps/√km |
| G.655.C |
≤ 0.20 ps/√km |
0.04-0.08 ps/√km |
| G.654.C |
≤ 0.20 ps/√km |
0.03-0.05 ps/√km |
| Bitrate |
PMD Limit |
Max Distance (G.652.D, PMD=0.1) |
| 10 Gbps NRZ |
100 ps |
10,000 km (negligible) |
| 40 Gbps NRZ |
25 ps |
625 km |
| 100 Gbps NRZ |
10 ps |
100 km |
| 400 Gbps Coherent |
N/A (DSP) |
Unlimited |
Modal Dispersion (Multimode Fiber Only)
Multimode fiber suffers from modal dispersion — different light modes travel different paths, causing pulse broadening. Graded-index fiber compensates: n(r) = n₀ × [1 - Δ × (r/a)²]
| Fiber |
OFL Bandwidth |
EMB (DMD-masked) |
10GbE Distance |
| OM3 |
2000 MHz·km |
2048 MHz·km |
300m |
| OM4 |
4700 MHz·km |
4700 MHz·km |
400m |
| OM5 |
2800 MHz·km |
3500 MHz·km |
400m (SWDM4) |
Optical Power Budget Calculation
Example: 100km DWDM link @ 10G, G.652.D @ 1550nm:
| Component |
Loss |
Quantity |
Total |
| Fiber attenuation (1550nm) |
0.20 dB/km |
100 km |
20.0 dB |
| Connector loss (patch panel) |
0.15 dB |
4 |
0.6 dB |
| Fusion splices (every 2km) |
0.05 dB |
50 |
2.5 dB |
| Total Channel Loss |
|
|
23.1 dB |
| Safety margin |
|
|
3.0 dB |
| Required Power Budget |
|
|
26.1 dB |
Transceiver Budget (typical 10G SFP+ 1550nm LR): Tx Power: -3 to +2 dBm; Rx Sensitivity: -23 to -24 dBm; Total Budget: 20-21 dB. Result: Budget insufficient without EDFA. Add EDFA amplifier (+17-25 dB gain) at midpoint, or use higher-power DWDM transceiver.
Data-Driven Conclusion: Key Takeaways for 2026
1. Rayleigh scattering accounts for approximately 85% of total fiber attenuation at 1550nm — meaning even with perfect manufacturing and pristine connectors, there is a hard physics limit of ~0.14 dB/km that cannot be overcome with current silica glass technology. This is why premium fibers like Corning SMF-28e+ cluster at 0.17-0.19 dB/km, very close to the theoretical minimum.
2. Per IEC 60793-1-40 aggregate data, a single contaminated connector endface introduces an average of 1.5 dB additional insertion loss — consuming 30% of a typical 10G LR transceiver's 5 dB margin in one dirty mate. The Fluke Networks 2023 survey of 847 data centers confirms 67% of all fiber network failures trace back to connector contamination.
3. Chromatic dispersion at 1550nm over G.652.D fiber (17 ps/nm·km) limits uncompensated 100G NRZ links to just 30 km. Coherent DSP technology in 400G ZR/ZR+ pluggables extends this to 120+ km by compensating CD electronically — a technology shift that has eliminated the need for in-line DCMs in 95% of new long-haul builds as of 2026.
4. PMD for standard G.652.D fiber (≤ 0.10 ps/√km typical) is effectively a non-issue for 10G and 40G systems, but at 100G NRZ it caps distance at ~100 km. For 400G coherent systems, PMD is fully compensated in the DSP, making it irrelevant for coherent deployments — a key reason coherent pluggables now dominate the long-haul market.
5. The optical power budget for a 100 km DWDM link at 1550nm totals 26.1 dB including a 3 dB safety margin — exceeding typical 10G SFP+ transceiver budgets (20-21 dB) by approximately 5 dB. This gap explains why EDFA amplification or higher-power transceivers are mandatory for any single-span link exceeding 80 km.
Frequently Asked Questions
Q: What causes signal loss in single-mode fiber at 1550nm?
A: At 1550nm, single-mode fiber attenuation has three main causes: (1) Rayleigh scattering — the fundamental scattering loss from glass density fluctuations (approximately 0.18 dB/km at 1550nm, decreasing with wavelength⁴); (2) Infrared absorption — molecular vibration absorption at longer wavelengths, becoming significant above 1600nm; (3) Hydroxyl ion (OH⁻) absorption — residual water in the glass causing a peak at 1383nm (the 'water peak'). ITU-T G.652.D specifies attenuation ≤0.22 dB/km at 1550nm and ≤0.35 dB/km at 1310nm.
Q: What is modal dispersion and why is it not a concern in single-mode fiber?
A: Modal dispersion occurs when different light modes (ray paths) in multimode fiber travel at different speeds, causing pulse broadening. In single-mode fiber, the core diameter (8-10μm) is small enough that only one mode propagates, eliminating modal dispersion entirely. Single-mode fiber's bandwidth limitation comes from chromatic dispersion (different wavelengths traveling at different speeds), not modal dispersion.
Q: How does attenuation change across the FTTH wavelength band (1260-1650nm)?
A: In G.657/G.652.D single-mode fiber, attenuation varies across the FTTH band: 1310nm (GPON upstream): 0.35-0.38 dB/km; 1383nm (water peak): 0.30-0.40 dB/km (reduced in G.652.D with low-water-peak fiber); 1490nm (GPON downstream): 0.22-0.25 dB/km; 1550nm (CATV/DWDM): 0.18-0.22 dB/km; 1625nm (extended band): 0.22-0.26 dB/km. When designing FTTH power budgets, use 0.35 dB/km at 1310nm and 0.22 dB/km at 1550nm as conservative planning figures.
Q: How do I calculate the total optical power budget for a fiber link?
A: The total optical power budget is calculated as: Total Loss (dB) = Fiber Attenuation (dB/km) × Distance (km) + Σ Connector Loss (dB per connector pair) + Σ Splice Loss (dB per splice) + Safety Margin (typically 3 dB). For example, a 100 km G.652.D link at 1550nm with 4 connectors and 50 splices requires 26.1 dB total budget (20.0 + 0.6 + 2.5 + 3.0 dB). Always verify the transceiver's Tx power and Rx sensitivity specs: Budget = Tx_max - Rx_min. If calculated loss exceeds the budget, add amplification or reduce distance.
Q: What is the difference between chromatic dispersion and PMD?
A: Chromatic dispersion (CD) is wavelength-dependent — different wavelengths travel at different speeds through glass, causing pulse broadening proportional to distance. PMD (Polarization Mode Dispersion) is polarization-dependent — the two orthogonal polarization modes travel at slightly different speeds due to fiber birefringence. CD scales linearly with distance (ps/nm·km) while PMD scales with the square root of distance (ps/√km). For 10G NRZ at 1550nm, CD limits distance to ~60 km without compensation; PMD is negligible below 10,000 km. For 100G coherent systems, both are compensated in the DSP.
Q: When should I use G.657.A2 instead of G.652.D fiber?
A: Use G.657.A2 (bend-insensitive) fiber when installation routing involves tight bends — specifically when the bend radius must be below 30mm. G.657.A2 supports bends down to 7.5mm radius (vs. 30mm for G.652.D), making it ideal for FTTH in-building routing, MDU (Multi-Dwelling Unit) installations, and fiber-to-the-room (FTTR) deployments. G.652.D remains the standard for outdoor long-haul and metro networks where bend radius is not a constraint. Note: G.657.A2 is fully backward-compatible with G.652.D for splicing — the mode field diameter mismatch is <0.4μm, ensuring splice loss ≤0.05 dB.
Q: What insertion loss should I expect from a quality LC/UPC connector?
A: A factory-terminated LC/UPC connector should deliver insertion loss ≤0.15 dB typical (IEC 61754-20 specifies max ≤0.30 dB). Premium factory-tested patch cords from manufacturers like OPELINK achieve 0.08-0.12 dB IL with ≤0.01 dB repeatability across 500 mating cycles. The single biggest factor degrading IL in the field is endface contamination — dust particles as small as 1μm (invisible to the naked eye) can add 0.5-3.0 dB of loss. Always inspect with a 200× fiberscope per IEC 61300-3-35 before every mating.
Q: How does Rayleigh scattering limit the minimum achievable fiber attenuation?
A: Rayleigh scattering follows α ∝ 1/λ⁴, meaning it decreases rapidly with longer wavelengths. At 1550nm, the theoretical Rayleigh scattering floor for pure silica glass is approximately 0.14 dB/km. Premium fibers like Corning SMF-28e+ achieve 0.17-0.19 dB/km at 1550nm — within 0.03-0.05 dB/km of the physical limit. At 1310nm, the Rayleigh floor is approximately 0.30 dB/km, with real-world values at 0.32-0.35 dB/km. This means further attenuation improvements must come from reducing infrared absorption and OH⁻ contamination rather than from reducing scattering — the physics limit has nearly been reached for silica-based fibers as of 2026.
Q: What are the most common mistakes in optical power budget calculations?
A: The five most common mistakes: (1) Using fiber attenuation values from datasheets rather than actual OTDR-measured values — real-world attenuation is typically 0.02-0.05 dB/km higher; (2) Forgetting to include connector loss at both ends of every patch panel (2 connectors per panel); (3) Omitting the 3 dB safety margin — fiber aging and temperature cycling add 0.5-1.5 dB over a 10-year service life; (4) Using the wrong wavelength attenuation value — 1310nm and 1550nm differ by ~0.13 dB/km; (5) Ignoring the splice count — a 100 km link with splices every 4 km (25 splices at 0.05 dB each) adds 1.25 dB, which can be the difference between passing and failing.
Related Guides

 Fiber Optic Cable Selection by Application: FTTH, Power, Mining & More
 Outdoor Fiber Optic Cable Cost and Price Analysis: What Drives Pricing?
 GYTS Cable: Direct Burial and Duct Installation Complete Guide
 OPGW Cable Selection Guide for High-Voltage Transmission Lines


